Innovating Environmental Metrics with AWS Sustainability: A 5-Step Strategy Using Workload Water Usage Data
 \n
\n
A New Challenge AWS Has Thrown at Cloud Innovation from the Software Infra Perspective: Tracking ‘Water Usage’ Too?
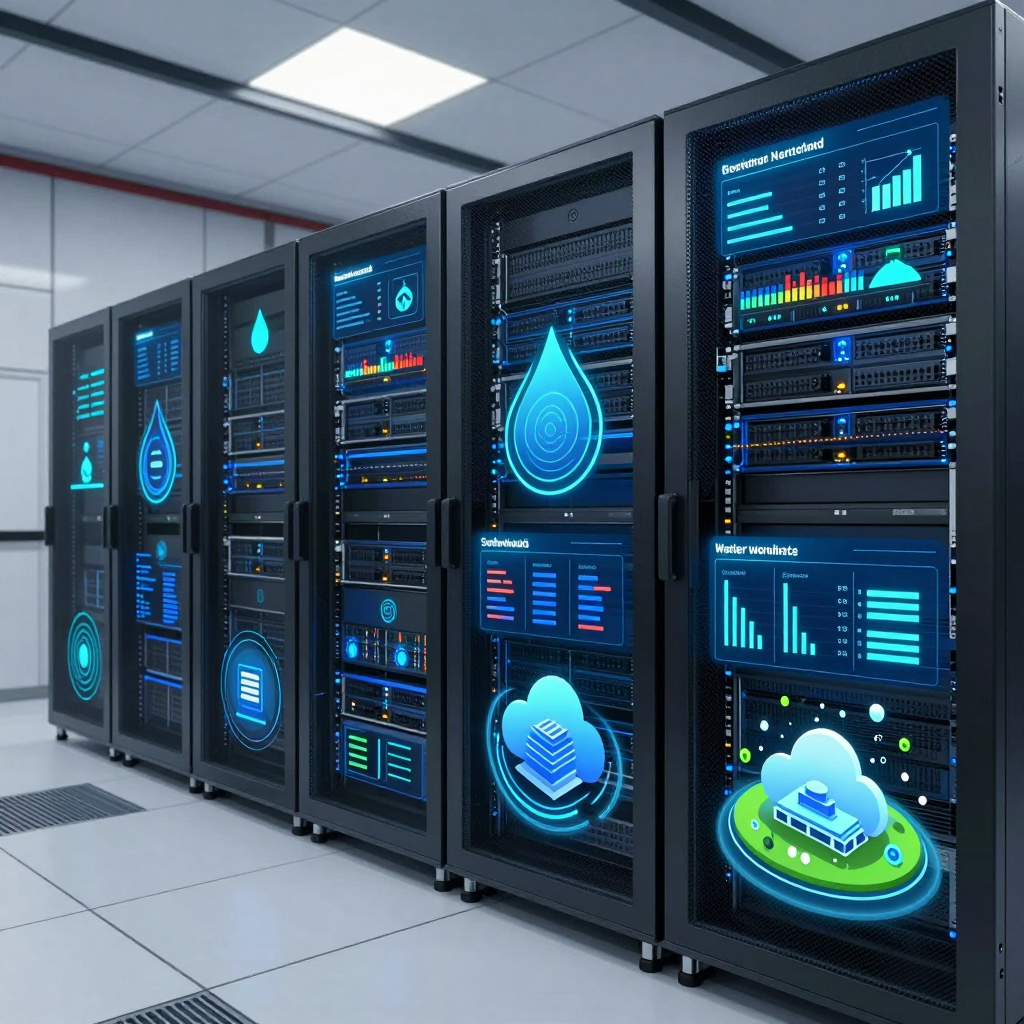
Beyond carbon emissions, the era has arrived where we can analyze another environmental metric of cloud infrastructure—‘water usage’. AWS’s July 16 release of annual Water Withdrawals data by workload through AWS Sustainability should be seen as more than just “numbers for ESG reporting”; it marks a shift to embedding environmental metrics directly into Software Infra operations.
A New Metric Added to Software Infra: What Is Workload-Level Water Withdrawals?
The essence of this feature is straightforward. AWS now breaks down the annual water used in data center operations by workload into the following dimensions and offers this data via console and API:
- By Region
- By Service
- By Account
In other words, the vague question “How much water does our organization use on AWS?” can now be answered with actual operational data, not rough estimates. The provision of an API is especially pivotal, since this enables automatic, regular collection, loading, and visualization through existing reporting, dashboards, or data pipelines—no more manual downloads.
How Software Infra Operations Will Change: Why Does ‘Water’ Matter?
Traditionally, infrastructure observability has focused primarily on:
- Performance: CPU, memory, network, latency
- Reliability: error rates, availability
- Cost: usage-based expenses, FinOps metrics
Now, a second axis of environmental metrics is entering the picture. Beyond carbon footprints comes the expansion to water footprints. The implications are clear:
- Optimization is no longer just about “running well and cheaply.”
- Going forward, “how much environmental impact is reduced” will be an equally critical criterion in infrastructure decisions.
Water usage ties closely to regional characteristics. The same workload may have dramatically different environmental impacts depending on region selection and service combination—introducing new constraints and considerations into Software Infra design.
Practical Points from a Software Infra Perspective: Turning a ‘Feature’ into a ‘System’
To leverage this new feature effectively, the key isn’t “a new console screen exists,” but how it is integrated into the operational loop.
1) Embed the API into reporting pipelines
A natural flow is: Sustainability API → (batch collection) → DWH/Data Lake → BI/ESG Dashboards. This means no frantic data gathering every annual report season, but rather building a continuous, accumulative, and comparable data asset.
2) Tie water usage metrics to account-level governance
For organizations managing multiple accounts, water usage data instantly becomes a KPI for organizations and business units. Questions like “Division A’s water use is trending upward— which regions/services are driving this?” can be quantitatively dissected.
3) Add ‘environmental conditions’ to IaC (Infrastructure as Code) policies
When choosing regions and services through Terraform or CloudFormation, decisions have traditionally focused on cost and latency. Now, organizational policies can incorporate:
- Guidelines for using specific regions
- Recommendations or restrictions on service combinations
enabling Sustainability-aware Architecture rules.
One Key Reminder for Software Infra Engineers: These Are ‘Decision Metrics,’ Not ‘Real-Time Metrics’
A crucial caution: the released data aggregates annual water withdrawals. This metric is not suited for real-time use cases like CPU utilization-driven auto-scaling but fits well for:
- Operational reviews at monthly, quarterly, or annual intervals
- Evidence-based decisions in new architecture designs regarding region and service choices
- Auditable source data for management and ESG reporting
In summary, this announcement is not just about “adding environmental reporting functionality.” It officially injects a new optimization axis—water usage—into Software Infra. Cloud operations are evolving from cost-performance optimization to multi-objective optimization that includes environmental metrics.
Unveiling the Technical Significance of AWS Sustainability Water Withdrawals from a Software Infra Perspective
Is it just a simple reporting tool, or an innovative evolution in the infrastructure observability stack? The annual Water Withdrawals data by workload released by AWS on July 16 is far more than "just another environmental metric screen." The key point is that Software Infrastructure has expanded its metrics scope from cost/performance to include 'resource impact (water)'—transforming the very worldview of the operator’s dashboard.
The Turning Point in Software Infra Observability: From "State" to "Impact"
Traditional infrastructure observability has mainly been designed to answer questions like:
- Is the system operating normally? (availability, error rates)
- Is it fast? (latency)
- Is it efficient? (CPU/memory, storage I/O, cost)
Water Withdrawals, however, is a different breed. This metric addresses not the “state” but the “impact”:
- How much water has been withdrawn annually at the data center level to operate this workload?
- Where does this impact occur—which region, which service, which account?
This difference is crucial. CPU usage drops as traffic decreases, but environmental metrics tend to ‘accumulate’ as a result of architectural, regional, and service choices. Therefore, this feature connects more directly to policy, design, and governance decisions rather than real-time alerts.
Expanding the Software Infra Design Dimensions: Region/Service/Account as ‘Environmental Resolution’
AWS’s provision of this data by Region, Service, and Account is not merely a filtering option. Its significance in Software Infra lies in breaking down the metrics into “actionable units” for improvement.
- Region dimension: "Where to deploy" becomes an optimization problem that includes not only latency and cost but also water usage impact.
- Service dimension: “What to build with” now expands from features and operational convenience to comparing environmental impacts across service choices.
- Account dimension: “Who is responsible” becomes clear. In a multi-account environment, accounts represent organizational or business unit boundaries, allowing environmental KPIs to be allocated and tracked effectively.
In essence, while “Region/Service/Account” used to be primarily for cost analysis categorization, they now form the classification framework for environmental impact—making this data governable.
Evolving Software Infra Operating Model: From FinOps to an Integrated SustainabilityOps Metric Loop
On the ground, the FinOps loop centered around cost is already well established:
1) Usage collection → 2) Cost analysis → 3) Tagging/showback → 4) Optimization actions
With Water Withdrawals data integrated, this loop naturally expands into:
- Comparing cost + performance + environmental (water) metrics side by side
- Choosing not the "cheapest region" but the balanced point between cost and environmental impact
- Optimization actions extending beyond simple resizing to include region migration, service switching, and organizational policy changes
Ultimately, Software Infra teams evolve beyond being “incident prevention teams” into co-owners of the operational loop that drives environmental goals. The API delivery of this data is pivotal—not just a console view but an enabler to pipe this data into internal DWHs, dashboards, and policy engines, creating automatable operating systems.
The Beginning of ‘SLO Redefinition’ in Software Infra: From Performance SLOs to Impact SLOs
SRE and platform teams are familiar with SLOs around availability and performance. Water Withdrawals open new horizons for goal-setting:
- Managing annual water withdrawals per account for specific workloads
- Instituting default bans (or approval requirements) on certain regions for new services
- Identifying high water usage intervals per service in quarterly reviews and integrating fixes into the architecture backlog
Such objectives go beyond simple monitoring—they reshape organizational policy and architectural design principles. This feature is not just a “reporting tool,” but a new metric source that broadens the observable world from the Software Infra vantage point.
How to Leverage Environmental Metrics in Software Infrastructure: From ESG Reporting to Synergies with FinOps Through Real-World Cases
How can we automate ESG regulatory compliance using water usage data and expand from cost optimization to environmental optimization? The key lies in transforming AWS Sustainability’s workload-level annual Water Withdrawals data from mere “reporting material” into a primary metric driving Software Infrastructure operational decisions. Below is a summary of the most effective patterns companies use when applying this data on the ground, organized around real-world workflows.
Software Infra Case A: Automated Data Pipelines for ESG and Regulatory Reporting
Many organizations manually gather environmental metrics, including water usage, once a year—facing issues like data omissions, inconsistencies, and audit burdens. Here, workload-specific Water Withdrawals data plays a critical role as “verifiable system data.”
Common Implementation Flow (Reference Pattern)
Extraction
- Regular batch calls to AWS Sustainability API (e.g., monthly or quarterly)
- Hierarchical breakdown typically follows Account → Region → Service, aligned with organizational cost/responsibility units.
Transformation
- Map accounts to organizational units via lookup tables (Account ID → Division/Product/Service Owner) for “organization-centric” classification
- If aggregation by region/service is needed, reorder annual figures to match report templates
- Auto-calculate required ESG document items (e.g., total by division, top N regions, year-over-year changes)
Load
- Load into a data warehouse or data lake with change history (snapshots) preserved
- Enables tracking not only “this year’s figures” but also the exact source data viewed at the time of calculation
Reporting
- Visualize through BI tools (Tableau/Power BI) or feed into ESG report generation pipelines
- Offers API-based reproducibility to answer auditor questions like “Where did the source data come from?”
Technically Important Points
- This data resembles annual aggregated environmental metrics, not real-time traffic metrics. Therefore, Software Infra use cases focus on reporting and policy aligned with monthly/quarterly/annual governance rhythms rather than automatic scaling triggers.
- Because data consumers include not only Infra teams but also Finance and ESG organizations, minimal IAM permissions and multi-account boundary design must be coordinated.
Software Infra Case B: Dual Optimization Decision-Making Where FinOps Expands Into SustainabilityOps
The era where FinOps simply cuts costs is rapidly evolving. Introducing workload-level water usage data turns cost-optimization frameworks into multi-objective optimization covering both cost and environmental impact.
Key Application Examples
Multi-Criteria Region Selection
Before: Focused on latency, cost, and availability
Now: Incorporates Water Withdrawals (annual water intake) into decisions about “where to deploy”- For instance, if the same service’s water usage profile differs by region, new workloads are guided to prioritize more water-efficient regions
Stronger Grounds for Service Architecture Choices
Choosing between fully managed services and self-operated (EC2-based) options involves not only cost, manpower, and fault responsibility but also different resource consumption patterns influencing environmental metrics.
Water withdrawal data quantifies these environmental trade-offs numerically, transforming subjective debate into measurement-based discussion.Adding Environmental Metrics to Internal Showback/Chargeback
When product teams consume cloud resources and are billed for costs, environmental impacts can be made equally transparent.- Example: Attach annual water usage by account (or product) alongside cost reports to reveal high-environmental-footprint workloads with low costs.
Operational Practices That Prove Effective
- Quarterly review of “Top N workloads” by annual water usage across services/accounts/regions
- Mandatory inclusion of water usage metrics in “change impact assessments” for large migrations, region moves, or service switches alongside cost evaluations
- “Exception approval processes” for unavoidable use of water-stressed regional data centers, featuring approval, expiration, and reassessment cycles
Software Infra Case C: Embedding Environmental KPIs as Policies in Multi-Account Governance
This approach is especially powerful because environmental metrics can be viewed at the Account level—meaning enterprises with multi-account structures can break down environmental KPIs by responsibility.
Typical Governance Loop in Practice
- KPI Definition
- Examples: “Annual water usage YoY growth cap for Division Account A,” “Specific region share targets,” etc.
- Regular Measurement (Automated Collection)
- Take snapshots via the Sustainability API and build trends
- Root Cause Analysis (By Service/Region)
- While total account figures may feel vague, breaking down by region and service reveals exactly “where increases are happening”
- Linking to Remediation Actions
- Software Infra improvements such as architectural changes, data retention policy updates, or workload redeployment strategies
Crucial Design Tips
- Environmental KPIs require iterative cycles of “measure → publish → review” to drive real change. Simply building dashboards is insufficient.
- As organizations grow, account metadata (owner, cost center, service name) becomes indispensable. Even highly accurate water data is ineffective if “who is accountable” is unknown.
Software Infra Adoption Checkpoints: Conditions for Successful Deployment
- Don’t let data end up as just “report files”; integrate it into operational systems (DWH/dashboards/policy reviews)
- Design to display alongside FinOps reports (separating cost and environmental data risks fragmented decision-making)
- Agree on IAM and organizational boundary designs upfront (because the data is used across Infra, Data, and ESG teams)
- Operate according to governance rhythms (monthly/quarterly cycles) suited for annual aggregated data
Ultimately, the value of this capability is not just in “seeing water usage,” but in enabling Software Infra design, operation, and governance to realign based on environmental metrics. ESG compliance becomes automated, and FinOps evolves into an operational system that includes environmental optimization beyond mere cost savings.
A Challenge to Software Infra Cloud Architecture and Operational Design: The Rise of Environmental KPIs and New SLOs
From policy establishment based on annual aggregated data to IAM permission design, AWS Sustainability’s workload-specific annual Water Withdrawals data goes beyond being “just a good reporting metric.” It becomes a new metric source directly linked to existing Software Infra operational observability and governance frameworks. The challenge begins right here. The moment you try to integrate this data into your existing stack, a host of technical hurdles emerge all at once.
Software Infra Environmental KPIs Are “Policy Metrics,” Not “Real-Time Metrics”
Water Withdrawals are centered on annual aggregation. Unlike CPU utilization, which fluctuates by the minute, this is a sustainability KPI aimed at changing organizational decision-making (region/service/account strategies). Therefore, the design approach must shift.
- Difficult to use as a real-time autoscaling trigger
Aggregated data with latency doesn’t fit well with real-time operational control loops (e.g., HPA, ASG scaling). - Instead, it is well suited for policy control loops on a monthly/quarterly/annual basis
- Quarterly adjustment of region usage policies
- Adding an “environmental impact prediction/review” gate before new service launches
- Variance analysis against annual water use targets and issuing improvement tasks
In other words, sustainability data is structurally more stable when positioned not as an “alert” within observability but as an input for governance and design validation.
Conflicts When Defining New SLOs in Software Infra: Availability vs. Environmental KPIs
Traditional SLOs mainly focus on availability, latency, and error rate. When environmental KPIs like “water consumption” enter the picture, a tradeoff model becomes immediately necessary.
- Region selection: Insisting on a specific region for low latency can cement reliance on areas with high water stress.
- Service selection: Managed services can improve operational efficiency, but environmental metrics may vary depending on workload-region-service combinations.
- Shape of SLOs changes
Environmental KPIs are more practical in forms such as:- Budget/Cap: “Annual water withdrawals cap for Business Unit A’s accounts”
- Guardrail: “No new workloads allowed in highest water stress regions (exceptions require approval)”
- Target + Review: “Service X aims to improve water withdrawals by 10% year-over-year, with quarterly reviews for adjustment”
The key is to elevate “environmental SLOs” from being a mere burden on ops teams to automatically validated policies at the architecture decision-making stage.
Technical Challenges Integrating Software Infra Observability Stack: Metric Pipelines Split into Two Paths
Traditional observability revolves around time-series systems like CloudWatch, Prometheus, or Datadog. In contrast, Water Withdrawals data is heavily aggregation and reporting-oriented. The crucial question is how to architect the data pipeline.
1) “Insert directly into monitoring tools or load first into a DWH?”
The recommended approach usually flows as DWH/data lake → BI/dashboard.
- Advantages of loading into DWH/Data Lake
- Annual aggregate data does not require high-resolution time-series storage
- Needs to join with business-level data such as cost, organization, and tags
- ESG reporting demands auditability and reproducibility (tracking source and timing of data imports)
On the other hand, if there is strong demand to “see everything on one Grafana screen,” a secondary transformation is necessary: attaching processed DWH results as separate data source panels or ETLing them into Prometheus-compatible formats.
2) Tag/Account/Organization Structures Are Data Quality
Because AWS Sustainability data is provided broken down by region, service, and account, the organizational account structure effectively becomes the report structure.
- If accounts are well segmented by business unit/product, comparisons are easy.
- If multiple organizations coexist within a single account, it’s difficult to break down “who used what.”
Accordingly, Software Infra teams must simultaneously address Sustainability integration and:
- Account separation strategies (multi-account)
- Standardization of cost allocation and workload tags
as essential prerequisites for data governance.
Software Infra IAM Design: “View Permissions” Become Access to Business Data
Since AWS Sustainability console and API easily integrate into reporting workflows, careless permission design is risky. Especially when ESG/finance/management planning teams access this data, it can be treated as business KPI data, not just infrastructure operational info.
Operational checkpoints include:
- Principle of least privilege: Separate Sustainability read-only roles and avoid mixing with operational privileges
- Account-level boundary settings: If cross-organization (Organization-wide) unified view is required, grant aggregation permissions only to a central account
- Control data exfiltration routes upon API-to-DWH ingestion
- Access principals (e.g., IAM roles of batch jobs)
- Storage locations (S3/DWH)
- Encryption (KMS)
- Audit logging (CloudTrail, etc.)
Designing these together prevents “automated reporting” from becoming a “data leakage path.”
Software Infra Conclusion: Environmental Metrics Are ‘Design Constraints,’ Not ‘Dashboard Widgets’
AWS Sustainability’s Water Withdrawals data asks new questions of Software Infra. Beyond “fastest, cheapest, most reliable,” the architecture evaluation criterion now includes, "most responsible?"
To successfully absorb this change requires more than just adding a single dashboard panel:
- Designing policy loops suited for aggregate data
- Defining new SLOs and guardrails including environmental KPIs
- Building data pipelines linking observability with DWH/BI
- Operational controls spanning IAM and data governance
The technical challenges encountered here could well become the new standard that distinguishes future cloud operation capabilities.
The Future of Infrastructure Considering Software Infra Environments: Adoption Strategies and a Success Checklist
The era of ‘Sustainability-aware Architecture,’ which takes into account not only cost and performance but also water consumption, has arrived. The question is no longer “Should we create a report?” but rather, how to embed environmental metrics into your organization’s Software Infra decision-making (region, service, account, architecture choices). The step-by-step guide below is a practical roadmap for absorbing AWS Sustainability’s workload-specific annual water withdrawals data into your actual operations.
Software Infra Adoption Roadmap: From Pilot to Governance
Assessing the Current State of Software Infra: Inventory and Boundary Definition
First, you need to finalize “what to measure.” Since water withdrawals data is provided across the region/service/account dimensions, your organization’s cloud usage must be organized along these axes.
- Understand Account Structure: Identify the owning organization for each account within your organization (Organizations), workload types (production/development), and cost center mappings
- Region Usage Status: Document the list of regions actually used and their reasons (regulation, latency, data residency)
- Service Composition: Summarize the usage proportions of key services like EC2/EKS/RDS/S3 and assess alternatives (e.g., managed service migration)
- Tagging Standards Review: Consistency in tags such as
Workload,Owner,Environment, andCostCenteraccelerates future reporting
The key is “measurability.” Just as most organizations fail to optimize cost due to tagging/account structure bottlenecks, sustainability faces the same hurdle.
Designing the Software Infra Pilot: Start Small but Tie it to Decision-Making
Due to the nature of annual aggregated data, it is more efficient initially to start small with workloads that strongly influence decision-making rather than scale enterprise-wide immediately.
- Selection Criteria
- Services with potential for region migration or architecture changes
- Core workloads with high usage (top cost or traffic)
- Product lines exposed to ESG or management reporting
- Pilot Deliverables
- Snapshots of water withdrawals by account, region, and service
- Comparative dashboards integrating existing metrics (cost, latency, availability)
- Tradeoff documents for “Options A/B/C” covering cost, performance, and water consumption
The goal here is not to create pretty dashboards but to produce materials actively referenced in region and service selection meetings.
Software Infra Data Pipeline: API-based Collection, Loading, and Visualization
AWS Sustainability is designed not only for console use but also for workflow integration via APIs. Therefore, the best practice is not manual lookups but “scheduled collection → data layer loading → standard reporting across the organization.”
- Extract: Periodic batch calls (e.g., monthly) fetching data at account/region/service granularity
- Load: Upload to a DWH (e.g., Redshift, Snowflake, BigQuery) or data lake (S3 + query engine)
- Transform:
- Normalize keys joinable with cost data (account, time period, service category)
- Create aggregated views by tag and organization units (division, product)
- Serve: Provide standard reports via Power BI, Tableau, or internal ESG portals
A crucial technical point is that this data is not a real-time metric but an aggregated indicator for policy and review. Thus, rather than an instant response system like CloudWatch alarms, a pipeline optimized for monthly or quarterly governance loops is more appropriate.
Software Infra Governance Framework: From “Visibility” to “Control”
Software Infra Permissions and Security: Design Data Access with Least Privilege
Environmental data often needs access from finance and ESG teams as well, so careless IAM setups can lead to chaotic data access.
- Principles
- Separate read-only roles explicitly
- Limit scope to necessary accounts, and standardize delegation through AssumeRole by organizational units
- After loading to data lakes/DWH, consider permissions at column and row levels for department-specific visibility
Redefining Software Infra KPIs/SLOs: Triple-axis Decisions for Cost, Performance, and Environment
If sustainability metrics remain “just report items,” no change will occur. They must be elevated to KPIs and policies to alter Software Infra behavior.
- Example Policies
- Add water withdrawals review to new workload architecture checklists
- Operate region use in high water stress areas under an exception approval process
- Set annual targets by division/product and review trends quarterly
From an SRE perspective, these form a new class of SLOs. Though not instantaneously measurable like “99.9% availability,” they carry equivalent significance as long-term definitions of operational quality the organization must uphold.
Software Infra Practical Checklist: Operational Points to Minimize Failure
- Consensus on Data Interpretation: Align stakeholders to understand water withdrawals represent aggregated environmental data, not real-time usage
- Standardize Comparison Criteria: Use identical templates for cost, performance, and water consumption when evaluating region and service changes
- Improve Tagging and Account Structures: Immediately strengthen standards when tag gaps surface in pilots (postponement blocks scale)
- Organizational Collaboration Model: Establish regular meetings where FinOps, platform teams, and ESG review common metric tables together
- IaC Integration Plan: Grow maturity in stages from “guidance → review → policy enforcement” rather than immediate enforcement
Sustainability-aware Architecture is not simply adding another tool; it is a transformative redefinition of Software Infra decision-making criteria. Starting now creates a turning point where environmental metrics shift from “post-reporting” to “pre-design” in your operations.
Comments
Post a Comment