 \n
\n
MLOps: Models Begin to Age the Moment They Are Deployed
What if an AI model that was accurate at first quietly began accumulating incorrect predictions a few months later? The system operates normally, API response times remain stable, and there are no server failures. Yet recommendations gradually become irrelevant, demand forecasts miss the mark, and anomaly detection models begin overlooking critical signals.
In such cases, the problem may not be that the model code is broken. It may be because the world the model learned from is no longer the world it operates in.
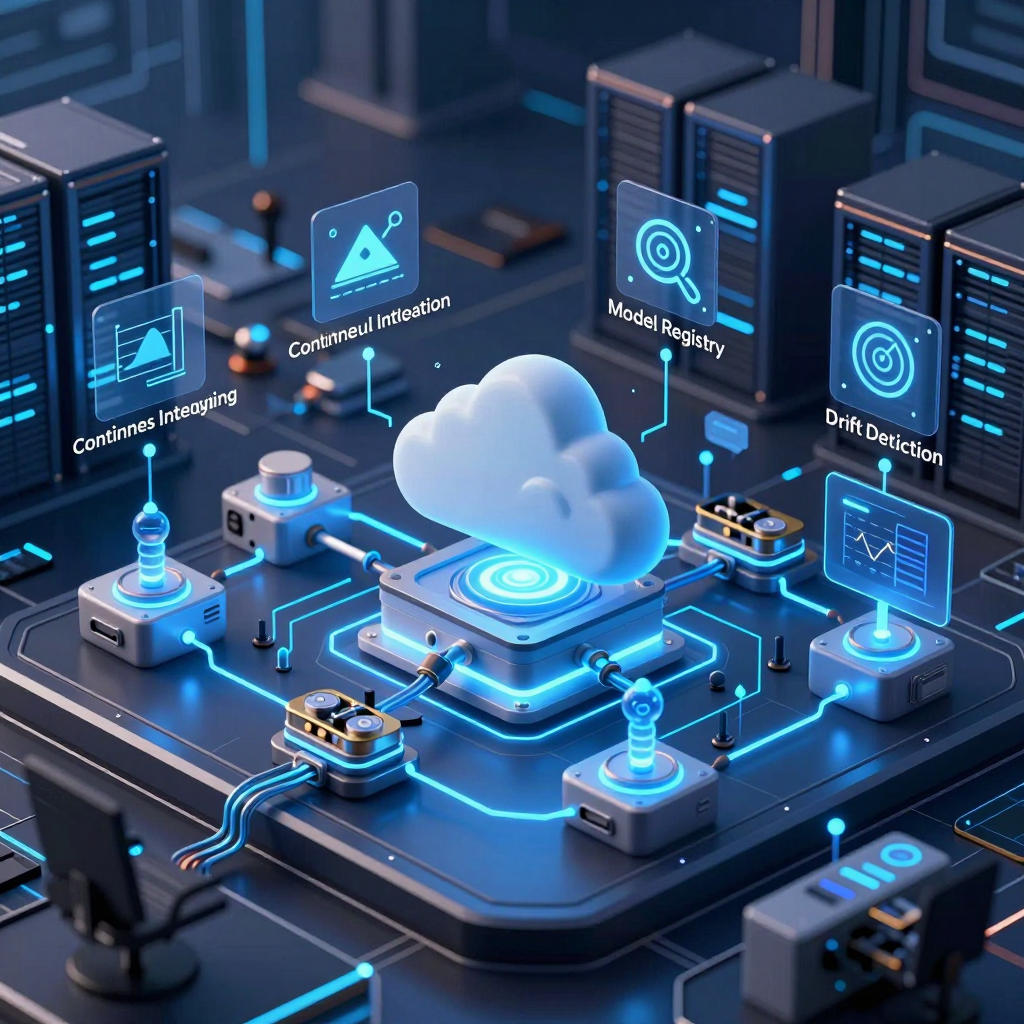
Deployment is not the end of a model’s journey. In fact, the moment real users and real data begin flowing in, the model becomes a product operating with the constant possibility of performance degradation. This is why MLOps must be more than a deployment technology—it must be an operational framework for continuously managing the model’s condition.
A Changing Reality Changes the Model’s Answers
Machine learning models learn patterns from historical data. But real-world data is never static.
Consider a demand forecasting model for an online retailer. Even a model trained effectively on the past year’s sales data may lose its predictive power as seasons change, competitors launch discount campaigns, consumer trends shift, and new product categories emerge. The same applies to financial fraud detection models. Attackers continuously devise new methods to evade existing detection rules.
These changes can be broadly divided into two categories:
Data Drift
A phenomenon in which the distribution of the input values entering the model differs from that of the training data. For example, the proportions of customer age groups, purchase times, or acquisition channels may change.Concept Drift
A phenomenon in which the relationship between inputs and outcomes themselves changes. In the past, a certain behavioral pattern may have indicated a high likelihood of purchase, but that same pattern may no longer lead to a purchase today.
The problem is that these changes usually happen quietly. The service does not go down, and the model does not throw an error. Yet the quality of business decisions gradually deteriorates.
A model’s failure does not always appear in server logs.
Sometimes, only the quality of its predictions slowly collapses behind perfectly normal responses.
MLOps Is a “Health Checkup” System for Models
In traditional operating environments, teams primarily verify whether deployment was successful. They check whether containers are running, APIs are responding, and CPU and memory resources are sufficient. These checks are certainly important. But for AI services, they are not enough.
MLOps monitors not only infrastructure health but also model quality. In other words, it continuously asks not only, “Is the service alive?” but also, “Is the model still making trustworthy decisions?”
To answer that question, production environments collect signals such as:
- How different the distribution of incoming data is from the training data
- Whether the probability distribution of predictions has changed abnormally
- Whether performance metrics such as accuracy, precision, and recall have declined when actual labels are available
- Whether errors are concentrated among particular customer groups, regions, or product categories
- Whether inference latency and infrastructure costs remain within acceptable limits
For example, if the approval rate of a loan evaluation model suddenly rises sharply, it may not mean the model has improved. The format of the input data or the composition of the customer base may have changed instead. Conversely, if predicted probabilities become excessively skewed toward one side, it may be necessary to investigate a data pipeline failure or a sudden shift in market conditions.
That is why a strong MLOps environment must go beyond a simple dashboard. It needs a model observability framework that monitors quality, reliability, and cost together.
An Unbroken Operational Loop—from Detection to Retraining
The purpose of monitoring does not end with discovering a problem. The key is to connect detected signals to concrete improvement actions.
In production-grade MLOps, teams typically design a workflow like this:
- Collect data on the deployed model’s inputs, predictions, performance, and costs.
- Detect whether drift or performance degradation has exceeded a defined threshold.
- When predefined conditions are met, run a retraining pipeline automatically or with approval.
- Compare and evaluate the model trained on new data against the existing model.
- Register only models that pass validation in the model registry.
- Conduct a canary deployment by first releasing the model to a portion of user traffic.
- Expand the new model to the entire service once its quality and cost remain stable.
- Roll back immediately to the previous version if problems arise.
This process is known as Continuous Training, or CT. The important point is that “automatic retraining” is not the goal in itself. If a model is retrained every time the data changes slightly, quality and costs may actually worsen.
Retraining requires clear criteria. For example, decisions should be based on a combination of signals, such as declining accuracy, shifts in input distributions, worsening business KPIs, or the passage of a certain period of time. It is also essential to verify that the new model genuinely outperforms the existing one and to retain a complete record of approvals, deployments, and rollbacks.
Deployment Is Not an Event—it Is the Beginning of Operations
Deploying an AI model once and then forgetting about it is no longer safe. In environments where customer behavior, market conditions, regulations, content, and fraud patterns change rapidly, a model’s useful life may be much shorter than expected.
That is why the starting point of MLOps should not be, “How do we deploy the model?” Instead, it should be these questions:
- How will we know that the model’s quality has declined?
- What kind of change will trigger retraining?
- By what standards will we prove that the new model is better?
- If a problem occurs after deployment, how quickly can we roll back?
- Does the improvement in quality justify the additional infrastructure cost?
Enabling a model to monitor its own condition, detect signals of change, and retrain itself through a validated process—that is the most practical reason to design MLOps for cloud environments.
The 5 Engines Powering a Production MLOps Platform
Successfully deploying a single model does not mean MLOps is complete. The real test begins when the data changes, user behavior shifts, and model performance starts to fluctuate.
A model in a production environment is closer to a living system. New data flows in, signs of performance degradation emerge, and retraining followed by safe redeployment must occur when necessary. Making this possible are the five core engines of a production-grade MLOps platform.
CI/CD Pipelines That Manage Code, Data, and Models Together
Where traditional DevOps CI/CD focuses on building and deploying application code, MLOps covers a much broader set of assets. Not only code, but also training data, feature definitions, model artifacts, and evaluation results must all be treated as deployable assets.
A typical workflow looks like this:
Data preparation → Feature generation → Model training → Performance evaluation → Packaging → Deployment
Each stage is connected through automated testing and version control. For example, teams can verify before deployment whether the data schema has changed, whether the missing-value ratio exceeds the threshold, or whether the new model performs better than the existing one.
The core value of this structure is reproducibility. It must always be possible to determine and rerun the process: “Who built this model, using which code and which data?” Git-based management and automated pipelines elevate this reproducibility to an operational standard.
A Model Registry Responsible for Approval and Traceability
A model registry is not merely a file repository. In production MLOps, it serves as the central control point for managing a model’s history and approval status.
A registry typically stores the following information:
- Model version and creation time
- Versions of the code, data, and features used for training
- Evaluation metrics such as accuracy, F1 score, and AUC
- Deployment environment and current status
- Approvers and deployment history
- Version information for reverting to a previous model
For example, instead of deploying a new model directly to the production environment, teams can register it in the Staging stage. Only models that pass automated evaluation and review by the responsible team are promoted to Production. This approval workflow prevents hasty deployments and, in heavily regulated industries, provides evidence for audits.
Tools such as MLflow Model Registry and Vertex AI Model Registry support model versioning, metadata management, and lineage tracking. More important than any specific tool, however, is the principle of treating models as verifiable product assets.
Automated Deployment and Rollback That Reduce Risk
A new model producing strong results in offline evaluation does not guarantee the same performance in a real service. Production data differs from training data, and traffic patterns and system latency may also diverge from expectations.
That is why production MLOps does not switch all traffic to a new model at once. Instead, it uses deployment strategies such as the following:
- Canary deployment: Applies the new model to only a portion of the traffic initially.
- Blue/green deployment: Separates the existing and new environments, then switches traffic after validation.
- Traffic splitting: Divides traffic between the existing and new models at set ratios to compare performance.
- Automated rollback: Restores the previous model if error rates, latency, or prediction quality fall below defined thresholds.
For example, when replacing a credit risk model with a new version, the new model may initially be applied to only 5% of all requests. At this stage, the team compares the new model’s approval rate, error rate, response time, and actual post-deployment outcomes with those of the existing model. If the model meets the required criteria, its traffic share is gradually increased to 20%, 50%, and then 100%. If any abnormal signs appear, the system immediately reverts to the previous version.
Infrastructure tools such as Kubernetes and Istio, as well as cloud-managed serving services, provide the foundation for implementing these safe deployment patterns.
Drift and Cost Observability That Monitors Quality and Expenses Together
A service responding normally does not necessarily mean the model is operating normally. Even if a model API maintains 99.9% availability, declining prediction quality is effectively a business outage.
MLOps monitoring must therefore extend beyond infrastructure metrics to include model quality.
| Observability Target | Key Question | |---|---| | Data drift | Has the distribution of production input data diverged from the training data? | | Concept drift | Have the relationship between inputs and ground truth, or user behavior, changed? | | Prediction distribution | Are predictions becoming excessively concentrated in a particular class or score range? | | Performance metrics | After actual ground truth becomes available, have accuracy, precision, or recall declined? | | System metrics | Are response time, error rate, and CPU/GPU utilization stable? | | Cost metrics | Are per-request inference costs and total infrastructure costs within acceptable limits? |
Cost observability is especially essential when operating generative AI or large-scale models. Increasing model size or the number of calls to achieve higher quality can cause inference costs to rise sharply. A strong MLOps platform does not simply search for the “highest-performing model.” It continuously seeks the balance among quality, latency, and cost.
Continuous Training That Operates on Monitoring Signals
The final engine is Continuous Training, or CT. This is not simply a feature that retrains a model on predetermined dates. It is an operational system that initiates retraining based on meaningful signals captured by the observability system.
Common retraining triggers include:
- Data drift exceeding a defined threshold
- Actual performance metrics falling below an established standard
- A sufficient volume of new data accumulating
- External events such as seasonal changes or policy updates
- The need for a lightweight model to optimize cost or response time
Once retraining begins, the model must go through the same quality validation process as before. A model should not be automatically replaced in production simply because it was trained on new data.
Detect monitoring signal
→ Run retraining pipeline
→ Perform automated evaluation and compare with the existing model
→ Register in the model registry
→ Approve or promote based on policy
→ Canary deployment
→ Validate production performance
→ Full deployment or rollback
When this workflow is implemented, model operations move beyond one-time deployment tasks. They become a continuous product operations system that responds to changing data and environments, detects quality degradation, and improves models safely.
Ultimately, the competitiveness of a production MLOps platform is not determined by model accuracy alone. An operational AI system emerges only when the pipeline connecting code, data, and models; the registry controlling model history; the safe deployment framework; observability across both quality and cost; and CT for executing retraining are all connected as one coherent system.
MLOps: The 2026 Answer Is Not a Single Tool, but a Connected Platform
The expectation that adopting MLflow and setting up a Kubernetes cluster will solve your MLOps challenges quickly falls apart in the real world. The tools themselves may be excellent, but if experiment records do not lead to deployment approvals and deployment logs do not connect to retraining pipelines, operations will ultimately fall back on manual work.
In 2026, MLOps competitiveness will be determined not by whether you have a particular tool, but by whether you have connected code, data, models, infrastructure, and monitoring signals into a single operational flow.
Why Operations Become More Complex Even After Adopting Tools
Many teams begin with a combination like the following:
- MLflow for experiment tracking and model version management
- Kubernetes for model serving
- Airflow or Kubeflow for running training pipelines
- Prometheus and Grafana for infrastructure monitoring
- Terraform for provisioning cloud infrastructure
The problem is that each tool has its own interface, configuration, permission system, and metadata. Once model training is complete, it becomes difficult to see at a glance who approved the model, what data it was trained on, which version is currently running in production, or whether retraining was triggered when performance degraded.
In other words, adding more tools does not necessarily increase automation. It can instead increase the disconnect between tools.
The Core Is Not a “Pipeline,” but a “Connected Operating System”
A production MLOps platform is more than a simple training pipeline. It must form a closed loop—from the moment a model is created, through the point when its performance degrades in production, to retraining and redeployment.
A representative flow looks like this:
- Run the training pipeline based on data changes or a schedule.
- Record the training results and evaluation metrics in an experiment-tracking tool.
- Register only models that meet the required criteria in the model registry.
- Promote them to the Staging or Production environment according to approval policies.
- Use a canary deployment to validate real-world performance and latency on a portion of the traffic.
- Continuously monitor inference logs, drift, cost, and error rates.
- Trigger the retraining pipeline when performance degradation exceeds a defined threshold.
- Run the new model through evaluation, approval, and deployment once again.
What matters in this structure is not “which tools are being used,” but whether the state and decisions at each stage are reliably passed on to the next.
A Model Registry Is More Than a Storage Repository
In a connected MLOps environment, a model registry is not merely a place to store model files. It becomes the governance hub that connects development and operations.
A well-managed registry should be able to answer the following questions immediately:
- Which model is currently running in production?
- Which code and data versions were used to train it?
- What performance criteria did it meet?
- Who approved its deployment to Production, and when?
- Which model should be used for rollback in the event of a failure or performance degradation?
If this information is scattered across separate documents, chat messages, and personal laptops, it is difficult to call the setup automated MLOps. Model lineage and approval history are the foundation of deployment automation, audit readiness, and incident recovery.
Observability Must Cover Model Quality and Cost—not Just Infrastructure
Traditional DevOps monitoring has focused on CPU utilization, memory, network traffic, and service response times. In MLOps, however, a service can respond normally while the model continues to make incorrect predictions.
That is why observability in 2026 must address at least the following layers together.
| Observability Area | Metrics to Monitor | Operational Response | |---|---|---| | Service reliability | Latency, error rate, availability | Autoscaling, incident response, rollback | | Model quality | Accuracy, prediction distribution, business KPIs | Performance validation, deployment halt, model replacement | | Data changes | Input distribution, missing values, category changes, drift | Data quality checks, retraining triggers | | Cost efficiency | GPU/CPU utilization, inference cost per request, storage costs | Model optimization, infrastructure adjustments, traffic policy changes |
As the use of generative AI and large-scale models continues to grow, cost observability is no longer optional—it is essential. A team may adopt a larger model to improve quality, only to see the cost per request surge and the service’s profitability deteriorate.
Platform Design Begins with Standardization
Not every team needs to build a massive integrated platform from day one. What matters more is defining connection rules and operational standards before adding more tools.
For example, teams can begin by standardizing the following:
- Naming conventions for model names, versions, and deployment status by environment
- Version-control practices for datasets and features
- Minimum performance criteria for model promotion
- Canary deployment ratios and automatic rollback conditions
- Thresholds for drift and cost alerts
- Mandatory validation steps following a retraining run
- Audit-log policies for changes to models, data, and infrastructure
These standards are what make it possible to build a consistent MLOps flow, regardless of whether the team chooses MLflow, Kubernetes, Airflow, a cloud AI platform, or another tool.
Ultimately, MLOps in 2026 is not about finding the “best tool.” It is about designing a platform that connects changing data and models, infrastructure costs, and operational risks into a single feedback loop. Tools are merely the means of bringing that design to life. The real competitive advantage comes from a connected operating structure.
MLOps Engineer 2.0: The New Conductor Between Models and Infrastructure
A data scientist building a highly accurate model does not guarantee that the service will operate reliably. In a real production environment, data distributions can shift, traffic can surge, and inference costs can exceed expectations. Changes to security policies, incident response, declining model performance, and deciding when to retrain are also unavoidable challenges.
The role that connects and takes responsibility for this entire flow is the MLOps Engineer 2.0.
An MLOps Role That Goes Beyond Model Deployment
In the early days, MLOps often focused on deploying models developed by data scientists to servers or cloud environments. Today, however, MLOps does not end with deployment. It must design and operate the entire lifecycle so that models continue to produce reliable results in production.
An MLOps Engineer 2.0 must be able to answer the following questions:
- What data and code versions were used to train this model?
- Is it safe to deploy the new model to all users immediately?
- Is prediction quality declining, or is this simply normal data variation?
- When should the model be retrained to maintain performance?
- Do the model’s response time and cloud costs meet the service objectives?
- If an incident or performance degradation occurs, can we immediately revert to the previous model?
In other words, this role is less a simple deployment specialist and more a technical coordinator—and the conductor of operations—connecting the model development team with the platform and infrastructure teams.
The Operating System Designed by MLOps Engineer 2.0
In a production MLOps environment, code, data, and models are not treated as separate assets. They must be viewed as three interconnected elements that together form a single deployment unit.
For example, when a model is retrained with new data, simply replacing the model file is not enough. You must be able to track which data snapshot was used, which feature transformation logic was applied, and which evaluation criteria the model passed. To achieve this, MLOps engineers establish systems such as the following:
| Operational Area | Core Responsibility | |---|---| | CI/CD·CT Pipelines | Automate training, evaluation, deployment, and retraining | | Model Registry | Manage model versions, performance metrics, approval status, and data lineage | | Deployment Automation | Implement canary and blue/green deployments, traffic splitting, and automatic rollbacks | | Monitoring | Observe latency, error rates, prediction quality, and data drift | | Cost Management | Optimize GPU·CPU usage, inference costs, and storage expenses | | Security·Governance | Manage access control, audit logs, approval procedures, and sensitive data protection |
Only when this structure is in place can a model become a continuously managed service asset rather than a one-time project deliverable.
Core Competencies Lie at the Intersection of Cloud and Machine Learning
Expertise in just one field is not enough for an MLOps Engineer 2.0. They must understand both how machine learning models work and how cloud infrastructure is operated.
Key technical competencies include the following:
Cloud and Container Operations
Design model-serving infrastructure using Kubernetes, Docker, serverless inference environments, autoscaling, and more.Infrastructure as Code (IaC)
Use Terraform, Helm, and GitOps to configure development, staging, and production environments consistently. Reducing manual configuration is essential to improving reproducibility and reliability.CI/CD and Pipeline Orchestration
Use GitHub Actions, GitLab CI, ArgoCD, Airflow, Kubeflow, Databricks Workflows, and other tools to define training and deployment processes as code.Model Lifecycle Management
Manage experiment results, model versions, approval histories, and deployment statuses through tools such as MLflow and Vertex AI Model Registry.Observability and Incident Response
Use Prometheus, Grafana, and log analysis tools to monitor API latency, error rates, and resource usage. Data drift and changes in prediction distributions must also be analyzed alongside these metrics.Security and Governance
Design access permissions for data used by models, secrets management, audit logs, and deployment approval procedures. This area is especially important in finance, healthcare, and public-sector environments—often just as important as the technical components themselves.
Safe Validation Matters More Than Automation in Retraining
Continuous Training is a core MLOps concept, but automatically deploying a new model whenever drift is detected can be dangerous. New data may be influenced by a temporary event, or the retrained model may actually perform worse in certain segments.
For this reason, a mature MLOps environment incorporates safeguards such as the following:
- The monitoring system detects signals of data drift or performance degradation.
- The retraining pipeline generates a candidate model using new data.
- The candidate model is evaluated using the same validation criteria as the current production model.
- Only models that pass the criteria are registered in the Staging stage of the registry.
- A canary deployment is used to verify real-world performance and costs on a portion of the traffic.
- If the model meets the conditions for quality, latency, error rate, and cost, it is promoted to Production.
- If a problem is discovered, the system rolls back—automatically or manually—to the previous stable version.
In this process, the MLOps engineer is both the person who expands the scope of automation and the person who controls it so that automation does not make dangerous decisions.
Ultimately, the Goal of MLOps Is “Trustworthy AI Operations”
A good model is the starting point for a competitive AI service. However, what customers and businesses actually experience is not the model’s offline accuracy, but its response speed, stability, cost, and prediction quality in a service environment.
The MLOps Engineer 2.0 closes this gap. Even after a model is deployed, they monitor the data, detect performance degradation, control costs, and safely carry out retraining and redeployment when necessary.
Ultimately, MLOps does not end with the “art of building models well.” It is a system of operational engineering that enables models to continue working safely and economically over time.
MLOps Implementation Roadmap: From Git to Automated Retraining
You do not need to build a massive platform equipped with Kubernetes, a model registry, drift detection, and cost dashboards from day one. The moment an organization begins managing even a single small model with Git, it starts moving away from manual deployment and toward an automated AI operations system.
For Korean teams, a realistic approach to adopting MLOps is not to “build a perfect platform first,” but to automate the most repetitive and riskiest tasks currently slowing the team down. The roadmap below outlines the order in which a model can evolve from a PoC into a stable production service.
The First Step in MLOps: Managing Code, Data, and Models with a Git-Centered Approach
The first priority is to separate the model development process from personal laptops and file sharing through messaging apps. Training code, inference code, environment settings, and deployment configurations should all be managed in a Git repository.
A basic repository can be structured as follows:
ml-project/
├── src/                 # Data processing, training, and inference code
├── tests/               # Unit tests and data validation tests
├── configs/             # Training parameters and environment-specific settings
├── pipelines/           # Training and deployment pipeline definitions
├── infra/               # Terraform, Helm, and Kubernetes manifests
├── Dockerfile
├── requirements.txt
└── README.md
Three principles are especially important at this stage:
- Code version control: Track the logic used to build each model through Git commits.
- Environment reproducibility: Manage the Dockerfile and dependency files to minimize differences between development and production environments.
- Configuration separation: Do not hard-code API keys, data paths, or training parameters. Separate them into environment variables or configuration files.
You do not need to store all the data in Git. Instead, metadata should record the location of each data snapshot, extraction date, schema version, and preprocessing criteria. This makes it possible to answer the question, “What data was used to train this model?”
The MLOps Automation Stage: Validating Training Code and Data Quality with CI
Once Git-based management is in place, the next step is to connect automated tests to pull requests and merge events. CI is not merely a tool for checking whether Python code runs successfully. In ML systems, code, data, and model quality must be validated together.
Representative validation items that can be included in a CI pipeline are as follows:
| Validation Area | What to Check | |---|---| | Code quality | Linting, formatting, unit tests, and security vulnerabilities | | Data quality | Required columns, data types, missing-value ratios, and out-of-range anomalies | | Training reproducibility | Whether training runs successfully on a fixed sample dataset | | Baseline model performance | Whether performance remains within an acceptable range compared with the baseline model | | Inference contract | Whether input/output schemas and API response formats are preserved |
For example, in a credit scoring model, the CI process should verify that essential features such as customer income and delinquency history are not missing. For a recommendation model, it should check that the types of user IDs and product IDs remain consistent with the existing inference API contract.
This process can significantly reduce operational incidents in which “the code was deployed, but predictions failed because the data format had changed.”
The MLOps Operational Foundation: Introducing Experiment Tracking and a Model Registry
The next step after automated testing is to centrally manage experiment results and model versions. When data scientists run multiple experiments, recording only accuracy scores in a document makes it difficult to reproduce a model later.
By using MLflow, Weights & Biases, or a cloud provider’s model management service, teams can record information such as:
- The version and time period of the data used for training
- The feature list and preprocessing code version
- Hyperparameters
- Evaluation metrics such as accuracy, F1 score, AUC, and RMSE
- Model files and Docker image tags
- The person who ran the experiment and the execution time
- The version of the model currently deployed
A model registry is not merely a storage repository. It is the reference point for approval and deployment. For example, an organization can establish a policy in which only models that pass automated evaluation are registered in Staging, after which an operations manager or model owner reviews and promotes them to Production.
Once this structure is in place, there is no need to search through files when an operational model must be rolled back. A validated previous version can be selected directly from the registry.
Advanced MLOps Deployment: Starting with Small Traffic through Canary Releases
When introducing a model into production, it is safer not to expose the new version to all users immediately. This is especially true for models such as recommendation, price prediction, and anomaly detection models, which can directly affect user behavior and revenue.
A practical deployment flow is as follows:
- Register the new model in the
Stagingstage of the registry. - Review the offline evaluation metrics and data validation results.
- Route only a portion of production traffic to the new model.
- Compare response time, error rate, prediction distributions, and business metrics.
- Expand to all traffic if the model meets the required criteria.
- Automatically roll back to the previous model if anomalies appear.
The essence of a canary deployment is not only to verify whether the new model is “highly accurate,” but also whether it is “safe to operate in production.” A model may perform well in offline testing yet produce unexpected results when the real request distribution, latency requirements, or responses from specific customer segments differ from the test environment.
In the early stages, it is sufficient to begin with a cloud-managed endpoint and simple traffic-splitting capabilities. As traffic volume and service complexity grow, tools such as Kubernetes, Istio, and Argo Rollouts can be added incrementally.
The MLOps Observability Stage: Monitoring Drift and Cost, Not Just Accuracy
Model deployment is not the end. It is the beginning of operations. In production, what matters is not only whether the server is running, but also whether the model is still making valid predictions.
At a minimum, a monitoring dashboard should include the following metrics:
- Service reliability: Request volume, error rate, response time, and availability
- Input data changes: Feature distributions, missing-value ratios, and changes in categorical values
- Prediction changes: Prediction score distributions, class ratios, and changes in confidence
- Model quality: Accuracy, recall, and business KPIs when ground-truth labels become available
- Operational cost: GPU and CPU usage, inference cost per request, storage costs, and data processing costs
Drift deserves particular attention. For example, a delivery demand forecasting model can be affected by seasonal changes, weather, local events, and promotions from competing services. A model that performed well on historical data may lose predictive power when the input distribution changes.
However, drift detection should not automatically trigger retraining every time. The cause could be a temporary event or a data collection error. A safer approach is to establish multiple conditions, as shown below:
Drift detected
→ Check for data quality issues
→ Confirm degradation in performance or business metrics
→ Run the retraining pipeline
→ Register in Staging if validation criteria are met
→ Promote to Production after a canary deployment
The Completion Stage of MLOps: Connecting Monitoring Signals to Automated Retraining
Continuous Training is not simply a schedule that retrains a model every week or month. Its core purpose is to use real operational signals to determine when retraining is actually necessary.
Automated retraining triggers can be designed as follows:
- A change in the distribution of a specific feature exceeds a defined threshold
- Performance based on actual ground-truth labels falls below the baseline by a certain level
- A sufficient volume of new data has accumulated
- A point in time arrives when a change in the business environment is expected, such as the end of the month or the beginning of a quarter
- An operator approves an urgent retraining request
Even when retraining begins, the new model should not be deployed immediately. The goal of automation is not to eliminate people entirely, but to reduce repetitive work while creating a validation process that remains controllable.
Therefore, automated retraining should always be followed by these steps:
- Train the model on the new data.
- Compare its performance with the existing Production model.
- Evaluate fairness, stability, latency, and cost alongside performance.
- Register only models that meet the required conditions in the registry.
- Verify real-world operational performance through a canary deployment.
- Proceed with a full deployment only when no issues are found.
MLOps Adoption Priorities: Avoiding Overengineering for Korean Teams
In Korean organizations, it is not uncommon to adopt tools first and establish actual operating principles later. However, the success of MLOps depends less on the number of platforms in place than on the operating standards agreed upon by the team.
In the beginning, it is best to narrow the scope and proceed in the following order:
- Initial stage: Git, Docker, basic CI, and experiment tracking
- Operational readiness stage: Model registry, deployment approval process, and inference log collection
- Stabilization stage: Canary deployment, rollback, drift detection, and cost dashboards
- Advanced stage: Monitoring signal-based retraining, GitOps, IaC, and SLO management
The most important question is, “What is the greatest operational risk facing our team?” If losing model files is the biggest problem, start with a model registry. If manual deployment errors occur frequently, prioritize CI/CD. If performance degradation is discovered too late, monitoring and drift detection should come first.
Start by managing a single small model with Git. Then build a reproducible training pipeline and gradually automate deployment and observability. The MLOps foundation built this way will become more than a set of model operations tools—it will become a core organizational advantage for scaling AI services with confidence and reliability.
Comments
Post a Comment